Forum Replies Created
-
AuthorPosts
-
Hi Sarah,
Yes notes would count for the word count.
For that specific example, you could also just cite it as a reference, as you might for other resources (e.g., the Oxford English Dictionary).
cheers,
CatherineIt’s fine to use Word or Google docs!
Text in tables isn’t counted in the final word count. See further instructions here:
https://speech.zone/exercises/the-festival-text-to-speech-system/writing-up/formatting-instructions/cheers,
CatherineHi Shahed,
There’s no set preferred format, but what you suggest looks like a good way to go about structuring your answers!
cheers,
CatherineFor the question about 310Hz and 300Hz sine waves being added together, you need to zoom out a bit to actually see what’s happening. In the attached image I’ve zoomed out so that the x-axis (time) goes from 0 to 0.5 seconds.
You’ll see from the combine waved (3rd plot), that we now have a low frequency component appearing visible. There are in fact, 5 cycles of this in the plot in 0.5 second, so this is a new 10 Hz component. If you do this yourself in the notebook and listen to the sound, you’ll be able to hear this as a pulsing sound. This is often terms a ‘beat’ frequency.
What’s happening here is that the two sine waves are interfering with each other. Adding them together sometimes boosts the signal (‘constructive’ interference, but sometimes dampens the signal (‘destructive’ inteference). This happens in the regular pattern of amplitude changes we see in that figure.
If you’ve ever played a string instrument (e.g., the violin) you would probably have learned to listen for these sort of beats when tuning the instrument (presence of beat frequencies means your strings are out of tune relative to each other).
Here the beat frequency (10 Hz) is the greatest common divisor of the two input frequencies, which in this case is the difference in Hz between the two inputs.
It’s not in scope for this course but you see more details here:
https://www.animations.physics.unsw.edu.au/waves-sound/interference/index.html#7.4 (video)https://www.animations.physics.unsw.edu.au/jw/beats.htm (text with derivations and other info).
Thanks for flagging that the answer to that was missing in the answer sheet!
cheers,
CatherineAttachments:
You must be logged in to view attached files.Hi Zhujun,
We can think of a sine wave as the vertical projection of a “clock hand” vector rotating around a circle where we start at the coordinate (1, 0) as in the attached figure. At each time forward in time we move a step counter-clockwise. Moving backward in time is then equivalent to rotating clockwise. In this way, positive phase shifts move the rotating vector counter-clockwise (forward), while negative phase shifts move the rotating vector clockwise.
So, a phase shift of -90 degrees (-pi/2) moves the starting point (i.e., associated with time 0) clockwise (backwards) to the coordinate (-1, 0), as in the attached image. Once it starts rotating though it will keep going counter-clockwise (see the animation in the lab notes). So it’s as if you push the default sine wave to the right and start at the -1 amplitude point.
Since we’re essentially going endlessly around the circle on the left hand side of the attached figure, we can also see that a -90 degree phase shift gets us to the same starting point as a +270 degree (3pi/4) phase shift. So they are actually equivalent.
Attachments:
You must be logged in to view attached files.Hi Shahed,
There are a few different things going on here, which we will actually talk about more in the module 4 lecture (the Source-Filter model). I’ll lay out a brief summary here which will hopefully make the relationships clearer (though maybe it is more than you are asking for!).
1. Voice source, F0 and its harmonics: You can think of vocal fold vibrations are generating sounds at a particular F0. That F0 corresponds to the rate of vocal fold vibrations (opening and closing). Each opening results in a short burst of air pressure (i.e., impulse). Because it’s coming out of tube but air is bouncing back and forward, multiples of F0 are also amplified (i.e., harmonics). If F0 is 100Hz, then you are going to get harmonics of 100Hz, 200Hz, 300 Hz, etc.
2. Vocal tract as filter: If you just had the voice box and no vocal tract above that, you’d just get F0 and it’s harmonics. This is equivalent to the sound source “duck call” here: https://annex.exploratorium.edu/exhibits/vocal_vowels/vocal_vowels.html
Thankfully we do have vocal tracts! The shape that we create with our mouths and tongue position creates a filter that boosts some of the harmonics (that come from the vocal source) and dampens others. These correspond to the resonances of the vocal tract (as opposed to the vocal source), and is what we call formants in a spectrogram. We usually see these a dark bands spanning several harmonics. When we have out tongue in a kinda central position (the “schwa” vowel, ə), the formants are usually around (F1) 500Hz, (F2) 1500 Hz, (F3) 2500 Hz (we’ll talk a bit about tube models this week). These formant frequencies vary with tongue position.
So formants are independent of F0 in the sense that you can change your F0 but keep your vocal tract the same shape (same vowel, different pitch), and vice versa. The frequencies we see as boosted/dampened in a spectrogram will be harmonics (as that is what comes form the sound source), but the fact that they are boosted/dampened is independently controlled by the vocal tract shape (the filter).
3. The Discrete Fourier Transform: The DFT picks out what “pure tone” frequencies are in an input waveform. The spectrogram shading is basically a representation of the magnitude of specific frequencies from a set of frequencies determined by the input window size and sampling rate. This is independent of the F0 and harmonics of the input speech signal. The default window in Praat is small enough that you generally don’t see the fine detail of the harmonics in the spectrogram, just the formants as a kind of blurring over them (see module 2 lab).
The frequencies that the DFT can pick out faithfully depends on the number of input samples you give it. So for a fixed sampling rate, the longer the time window the more samples. So if my sampling rate was 8000 Hz, and my input window was 20 samples, I would be able to pick out 20 frequencies equally spread between 0 to 8000 Hz: 400 Hz, 800 Hz, etc. However, because of aliasing, only half of these are actually meaningful (the first half, up to half the sampling rate).
If we were to use this window size, but our F0 was 100 Hz, we wouldn’t be able to see the harmonics (multiples of 100 Hz) at all. Those frequencies would get picked up but they would be more or less aggregated over those 400 Hz bins, so blurred out on the frequency axis.
So, you can think of the source, filter, and the DFT as 3 separate things. The settings of the DFT (i.e., in terms of input size, sampling rate) determine the time and frequency resolution of a spectrogram and hence what exactly you can see of the source and the filter in a spectrogram.
cheers,
CatherineHi Shahed,
Yes, you’re right about this! The pressure nodes should be where pressure doesn’t change (i.e., is always zero). The antinodes are where pressure is changing from maximum to minimum.
There’s a good illustration/description of this here for standing sound waves:
https://www.acs.psu.edu/drussell/Demos/StandingWaves/StandingWaves.htmlPerturbation theory isn’t examinable in this course. But I’ll make a note of this for the publisher!
cheers,
CatherineActually, DOI access also seems to be unstable – sorry! Hopefully the library/Cambridge University Press will be able to fix this soon!
Here’s the direct link that (sometimes) works for me, in case you want to try:
https://www.cambridge.org/highereducation/books/phonetics/CA1E1B9EEF87F3C8061DA8A4DAB3FA23#contentsHi Shunyu,
There seems to be a specific issue with access to this book through the University of Edinburgh library website at the moment (there’s a small note on the library catalogue page). I can still access it through the direct DOI link though:
https://doi.org/10.1017/9781108289849
Can you see the book at that website? You may need to have the University VPN on if you are outside campus (or login with access through institution).
cheers,
CatherineHi Shona,
Based on our AI policy, you can use AI based tool to help with coding suggestions as long as you declare this in the report.
However, you should be careful to check that coding suggestions from LLMs as they can be incorrect, so to use this effectively you need to understand whether the generated code is good or not. The same advice applies to looking up answers to questions on websites like Stack Overflow (not all answers are good!).
Also, while you’re not being directly assessed on coding for this assignment, we do want you to learn some scripting skills. The best way to learn these skills in the long term is to try to figure things out yourself first!
cheers,
CatherineHi Sophie,
The AT 4.02 lab is open 8am-8pm Monday to Friday. If you are a PPLS student that’s probably the only lab that you can use in Appleton Tower. Informatics students will have access to other labs, but the computers in those labs won’t have access to the voice you need to use for the assignment.
Sorry that the remote desktop isn’t working! Could you report it to IS helpline with details of what exactly is not working? https://www.ishelpline.ed.ac.uk/forms/
cheers,
CatherineHi Emily,
Sorry I think that’s a reference to a previous version of the assignment! We’ll see about making a new template, though you really just need to make sure you use the section headings as described in the assignment instructions.
cheers,
CatherineHi Patricjia,
When you sample a sine wave that’s higher than the Nyquist frequency (i.e., half the sampling rate = 8000 Hz in the question) you still “record” a sine want it’s just that it’s not going to be the one that was your actual input. When you’re just a bit above the Nyquist frequency the inaccuracy in sampling the underlying input doesn’t cause too much difference. But it has a bigger and bigger impact the higher the frequency gets (past the Nyquist Frequency).
In fact, frequencies are mirrored around the Nyquist frequency. So, with a 16000 Hz sampling rate, a sine wave with frequency 8640 Hz = 8000 + 640 Hz looks like 8000 – 640 = 7360 Hz due to aliasing.
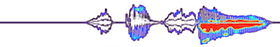
You can see a (different) example of this in the lab materials when we plot the sound sweep with naive downsampling from 22050 Hz to 8000 Hz sampling rate (in the “Sampling and Aliasing” section). The sound generated changes from a continuously rising frequency, to one that goes up to 4000 Hz and then starts going down. The spectrogram shows this with a turning point at 4000 Hz in the attached image. You can use the code blocks in the notebook just below that figure to see what’s happening in sampling terms.
cheers,
CatherineAttachments:
You must be logged in to view attached files.Yes! The relevant documentation is here:
https://www.fon.hum.uva.nl/praat/manual/Intro_3_7__Configuring_the_spectral_slice.htmlIf you look in the default “Advanced Spectrogram Settings…” (in the Spectrogram drop down) you’ll see that the default setting for Window Shape is “Gaussian”. The documentation says that for a window length of 0.005 s, “If the window shape is Gaussian, Praat will extract a part of the sound that runs from 5 milliseconds before the cursor to 5 ms after the cursor. The spectrum will then be based on a “physical” window length of 10 ms, although the “effective” window length is still 5 ms”. This is because the a Gaussian window shape basically reduces the amplitudes at the edges of the window. it’s a tapered window as discussed in this video: https://speech.zone/courses/speech-processing/module-3-digital-speech-signals/videos-2/short-term-analysis/.
So the number of samples in that window actually corresponds to the number of samples in 0.010 s given a sampling rate of 44100 Hz (the sampling rate of the recording). The length of the window in samples is the 44100 * 0.01 = 441 samples. But that still doesn’t quite get you the analysis frequencies you see in Praat for that specific example.
Praat actually does one more thing that changes the sample size (hence real window length), which is that it uses the Fast Fourier Transform. This is an efficient implementation of the Discrete Fourier Transform that is much faster than the original formulation. The catch is that it only works if the number of input samples is a power of 2. So in this case, the window is padded out with zeros to 512 samples (=2^9).
This is an option if you create a spectrum from the objects menu See the setting “fast” here (though I don’t recommend trying to understand the Fourier transform from the rest of that page!): https://www.fon.hum.uva.nl/praat/manual/Sound__To_Spectrum___.html
Though the use of the Fast Fourier Transform appears to be a fixed setting if you generate the spectral slice from the Sound viewer.
So, if you have 512 samples and a sampling rate of 44100, you get DFT analysis frequencies as multiples of 44100/512 = 86.13281 Hz (which is what Eli observed above!).
The moral of this story, is that for software (like Praat) which has a lot of potential options “under the hood”, you may need to check out the documentation to understand what exactly it’s doing!
Hi Xueyan,
Many apologies for this. It appears the sound wasn’t recorded in the first half. I’m not sure why. I’m fairly certain I turned the microphone on but may have done something while setting up.
If you have any questions about the lecture, feel free to ask here or in office hours!
Apologies again,
Catherine -
AuthorPosts
 This is the new version. Still under construction.