Forum Replies Created
-
AuthorPosts
-
Hi Yujia,
The way we talked about it in class,
X(m) represents the magnitude spectrum of the input window x(n). Similarly, H(m) represents the magnitude spectrum of the filter h(k).So if x(n) represents the impulse train, X(m) will represent the harmonics.
Since h(k) represents the filter, H(m) will give us the shape of the spectral envelope.But it’s worth noting that the convolution theorem also applies more generally, x(n) and h(k) could represent other types of signals (rather than just source and filter). But we are focusing on source and filter in this class.
cheers,
CatherineHi Tom,
I can connect to that machine from my end. Can you check whether you have the university VPN on (if you are outside the campus eduroam network)?If this happens on other machines as well,it would be best to contact IS Helpline to see if there’s anything the sys admins can see on their end:
https://www.ishelpline.ed.ac.uk/forms/
For VNC Viewer, you shouldn’t need an account with RealVNC (just the EASE login and password to access the machine).
cheers,
CatherineHi Eilish,
I think you might be on the Informatics remote desktop (since the computer name on your terminal is “theorbo” (which is an informatics machine). You can try the command
hostnamein the terminal to check if it has an inf.ed.ac.uk name.From what I remember, the Informatics servers do have Festival installed, but it’s an older version than the one we are using, and the voice data is not there.
The remote desktop we are using is a separate service run by PPLS (cross-school IT issues, sorry!) which you will need to connect to separately. To connect to the PPLS AT lab remote desktop, you’ll need to follow the instructions here: https://speech.zone/courses/speech-processing/module-0-getting-started/ (see Computing Requirements) and pick one of the machines from this list:
You’ll need to have the University VPN on for this to work (though the Informatics specific one might work as well).
cheers,
CatherineI’ve checked that it should be readable to you if you can log into the machine. Can you tell me what the output is if you run the following command:
ls -lh /Volumes/Network/courses/sp/assignment1/
Hi Eilish,
Would you be able to put this in as help request on via IS Helpline?
https://www.ishelpline.ed.ac.uk/forms/
The lab system administrators should be able to help. I’ll also ask them, but they can give you more specific help for your setup.
cheers,
CatherineHi Nickon,
For the course intro and signals lectures, you can download pdfs of the google slides from the shared links (File > Download > PDF document)
You can find the links at the bottom of the “Start” tab of the modules or here:
I’ll add the pdfs to the Module start pages, but if you want them right away you can get them directly via those links.
I don’t think Rebekka had specific slides for the module 2 lecture.
cheers,
CatherineHi Muminah, everyone
I’ve put solutions on Learn: practice question solutions pdf
On learn: Assessment > Practice Questions > Practice Question Solutions
cheers,
CatherineHi Paige,
You’re not missing anything! The thing to take away is that the difference between cosine and sine waves of the same frequency (and amplitude) can be characterised by a 90 degree (pi/2) phase shift.
The idea was to either try different phase shifts until you get something that looks like a cosine wave or to derive this based on the fact that one period is equivalent to 2pi (and you know cosine start at the positive peak of the wave so 1/4 into the sine wave cycle). But, yes, you might just know it as a mathematical identity!
cheers,
CatherineHi Christina,
It’s a complicated issue, but there’s some discussion of this in this public facebook group that you might find interesting:
https://www.facebook.com/groups/551898862199586/permalink/695289281193876One of the issues is that contrasts that are important for many non-European languages are relegated to diacritics or general made to seem much less frequent than they actually are if we look at different languages and speakers. Basically it’s not a theory neutral representation of the range of speech sounds.
There’s a nice interface that links to papers that describe how to transcribe non-European languages here that you might find interesting (noted by Amalia Arvaniti in that thread).
Similarly, many speech technologies depend on phonetic transcription (e.g. pronunciation dictionaries), where the transcription system is tailored to the language or accent that you want to develop the technology for. So in practice the IPA doesn’t work that well as a sort of general purpose transcription system (though there are some other computational issues that historically came into play here!).
Rebekka will have more to say about this but it may also be something to discuss in office hours (as Rebekka probably won’t be in the lab again for another few weeks).
cheers,
CatherineHi Rebecka,
Sorry about the delay in responding!
Your description of the relationship between the number of inputs and the DFT analysis frequencies is good. Sorry, I misunderstood your question in class and went on a bit of a tangent!
For your scenario: I would first just clarify that
“The number of input sample points in the analysis window equals the number of frequency outputs of applying the DFT to that window” which I think is what you are saying in any case.In point 2:
We are processing slices of the total wave, one window frame at a time. If we imagine that the square I have drawn over the dotted line is our window which we slide across the signal, then its width also determines what frequencies you can detect.
Yes!
Its width will determine what range of frequencies you could see BUT if you have set the sampling rate independently of the frame width then you will sometimes end up with a mismatch between which frequencies could be detected given window width vs. which frequencies are detected given the sample rate of the digitized signal. This results in the leakage effect in the frequency domain where we see a mismatch between where the formants appear in the plot vs. where they are supposed to appear given the harmonic structure that can be detected by our window.
I think you’ve got it, but it’s worth unpacking this a bit here!
1. If you have have a fixed number of samples per window, changing the sampling rate will change the length of the window (in seconds). Conversely, If you have a fixed sampling rate, changing the length of the input window (in seconds) will change the number of samples you can take in that window. So, if you always keep to the same number of samples in a window but change the sampling rate, DFT outputs will map to basis sinusoids of different frequencies.
2. Depending on what frequencies are actually in your input sample, you may get leakage with one sampling rate (due to change in window length) as opposed to the another. For example, assume your window is 10 samples long and your sampling rate is 1000 Hz. Then the DFT should be able to pick up multiples of 100 Hz faithfully. In contrast, if your sampling rate is 800 Hz (still 10 samples), the DFT would pick up multiples of 80 Hz. This means that a 100 Hz sine wave would appear as a single spike on the former, but cause leakage in the latter (spilling over into 80 Hz and 160 Hz, and potentially other frequencies in the spectrum).
– Is this correct or is it the case that the window width and the sampling rate are always set in tandem? Seeing as dt x N(samples) = window width, we have a close relationship between the two parameters which means that whatever sample rate we choose determines the width of our window. We don’t set them independently?
Yes, you’re right. We can consider window width in time and sampling rate independently, but this would then change the number of samples we can analyse in a window. In reality, the sampling rate is usually set first and then the window width is usually determined based on the application we have in mind (e.g. do we want a narrowband or wideband view of the spectrum? It turns out the seeing all the fine detail of the harmonic structure is not that use for word recognition, for example).
If this is the case then maybe my confusion above stems from the fact that I think of the process in several steps: first you digitize the analogue signal by sampling and then you “slide” a window across this signal to process it. Maybe this is totally wrong as the input to our system is instantaneous so you cannot separate the steps – segmenting and sampling take place simultaneously, as the analogue signal arrives in the system in real-time. ???
The input isn’t really instantaneous. The waveform needs to be sampled and quantized (i.e. discretized) so we can even get it onto the computer. We then do windowing and apply the DFT (and potentially other things) in the digital realm. So the leakage is really due to the fact that we can’t always know what exact frequencies will be in our (analogue) input (this is very much the case of speech as everyone’s voice is a bit different and so characterised by different frequency components!). Separately, we have constraints on memory for storing digital recordings (a higher sampling rate means you have to store more samples) and also for making sure we have a high enough sampling rate to capture the frequencies that are important for the task. For example, humans can hear up to around 22kHz but still understand people through telephones which only have 8kHz sampling rate (though we notice the loss of quality). Separate again are constraints based on what sort of frequency analysis we want to do (how much detail we actually want to extract).
Is it the case that you are able to find the coefficients of the basis functions through multiplication because of symmetry reasons? If you look at my drawing I have tried to visualize what I imagine is happening. The two plots on the bottom are supposed to show the same wave, ie “what would happen if we multiplied two identical waves together?”. We would do 1×1 at the first sampling point and -1x-1 at the second sampling point. The sum would be 2. Conversely, the diagram at the top shows what happens if we multiply two dissimilar waves together. At the first sampling point we get 1×0.75 and at the second point we get -1×0.75 and therefore end up with the sum of 0. In other words, we get cancelling effects for dissimilar waves because the amplitude of one will be positive whereas the amplitude of the other will be negative at certain points in time and we therefore get some negative products when we perform this step-wise multiplication. These cancelling effects are the same phenomenon that makes the basis functions orthogonal because if you would perform this multiplication on any pair of basis functions – instead of a basis function and the composite wave – they would cancel each other out completely?Does my description make sense? Have I understood what you meant in the video?
There are a few different things going on here:
- You can find the DFT coefficients (i.e. the DFT outputs) by performing the dot product.
- You can see that the dot product between DFT basis sinusoids will be zero because of symmetry of sinusoids around the x-axis of a time versus amplitude plot.
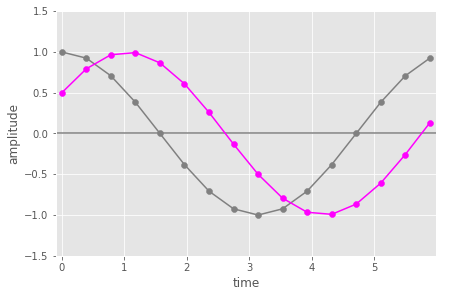
First let’s consider
– an input 16 samples of 1 period of a cosine wave with a small phase shift (magenta)
– 16 samples of a cosine wave of the same frequency (hence period) but without the phase shift (this is equivalent to the 1st DFT basis sinusoid) (grey).
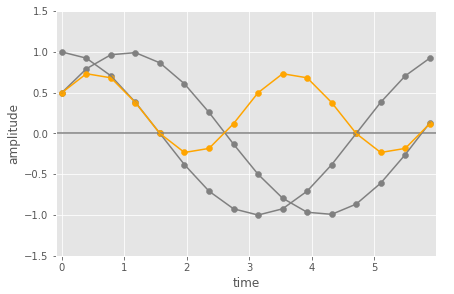
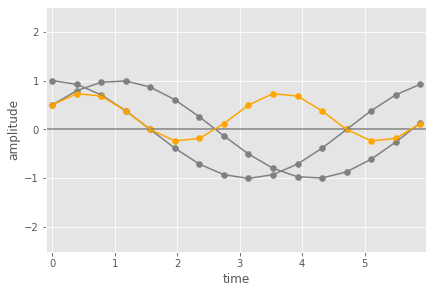
This next figure we see those two cosine wave, and the pairwise multiplication of the samples of those two waves (in orange).
Here you can see that the orange values are mostly above zero amplitude and the positive values have larger absolute values than the negative ones. When you add them up (as the last part of the dot product) you would get a non zero value (positive in this case). You can think of this as the average value of the multiplication points being above zero.
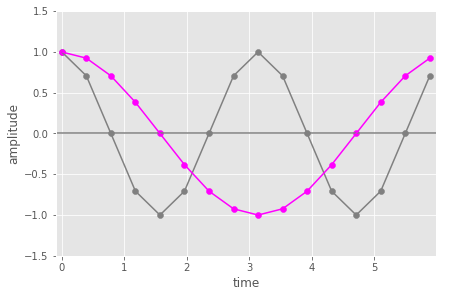
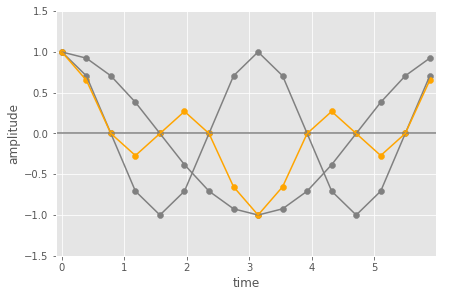
Now let’s look at the case where we the input is the 1st DFT basis sinusoid and we take the dot product with the 2nd DFT basis sinusoid (so twice the frequency of the 1st DFT basis sinusoids – 2 cycles in the same time window).
In this case, the pairwise multiplication results in values that are symmetric around zero amplitude. Over the period the average of the orange points will be zero (because the positive points are in in effect cancelled out by the negative ones).
You now might also think about this in terms of overall area under the curve being zero! But remember we don’t actually have a curve here, just the sampled points!
However, this links to the point (b) about integrals. Yes, it’s basically the same thing but since we are working in a discrete space we need to take sums instead of integrals. When dealing with continuous functions we use the Continuous Fourier Transform which takes the integral instead of the sum. The difference is that we have a limit of what dx can be (determined by the sampling rate) so we can’t make dx infinitely small as is required for an integral (but it’s the same concept). Instead we multiply the discrete samples that are aligned in time and sum them up.
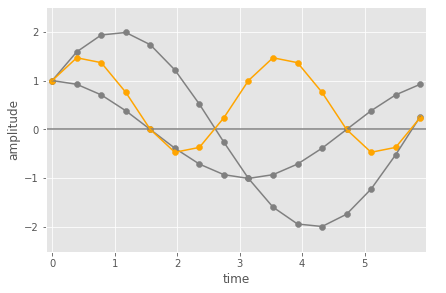
For point (c), Note that the dot product isn’t scaled, so it can be bigger than 1. The magnitude shown on the spectrum for a detected frequency will be proportional to the amplitude of that frequency in the input. You can see this in the figures below.
The first shows the same as above (same frequency with a phase shift) versus a version where the input has double the peak amplitude. The positive values in the pairwise multiplication (orange) are bigger, so the overall dot product (sum) value will be too.
Some these details are definitely easier to see if you go through the actual mechanics of the DFT equation. We’ve set the mathematical details as beyond the examinable scope of this course, but you can find some more detail on this in the Module 3 lab notebooks, specifically notebook 3 (“discrete Fourier Transform in detail”). This is marked as extension material but it still might be useful to play with the visualisation of the dot product at the end of the notebook.
Any complex periodic wave can be represented as a sum of weighted basis functions. The basis functions are orthogonal, meaning they have the same amplitude but are multiples of the lowest frequency sinusoid of the set. The question is how to find the coefficients / weights for these basis functions. The video explained that you take the sinusoid you want to weight and multiply it with the original wave. The product of this operation will be large for sinusoids which are similar to the original wave whereas it will be small for dissimilar sinusoids. This makes intuitive sense as you’d want to add more of the very similar basis functions than you’d want to add of the dissimilar ones when you add up sinusoids to create your complex wave.
We need to first clarify what “orthogonal” means here. The fact that the basis functions are orthogonal means that if you measure the similarity between the functions using a dot (aka inner) product (as we do in the DFT), the similarity will be zero. The fact that the sinusoids are multiples of the the lower frequency one guarantees this orthogonality property when we are dealing with discrete (i.e., sampled sinusoids) rather than continuous ones. This is what allows us to pick out the presence of specific frequencies with the DFT. When we do the dot product between the input and a specific basis sinusoid, we’re basically zeroing out all the frequencies and so just seeing how much of that basis sinusoid frequency is in the original signal.
To think about why the dot product works as a measure of similarity, we need to think about the sampled sinusoids as vectors. Each of the basis sinusoids consists of N samples (corresponding to the number of samples in the input window). This means we can think of each of the sinusoids as an N dimensional vector.
For example, let’s call the first basis sinusoid s1. The DFT represents this with N samples so s1 = [u1, u2,….,uN], where u1,..,uN represent the sampled amplitudes of that sinusoid in time. Similarly we can take second basis sinusoid as s2=[v1,v2,….,vN]. As sine waves they look like this:To calculate the dot product between s1 and s2 we first take the pairwise multiplication at each dimension of the vector, then sum all of those values together:
u1*v1+u2*v2+…+uN*Vn. So this gives us one number with corresponds to a how much the two vectors were pointing in the same direction. If this value is zero we intepret this geometrically as the vectors being orthogonal (i.e. perpendicular). Intuitively, you can think of this as meaning there is no correlation between the two vectors. This is a nice video that explains dot products and their geometric interpretation.
For the DFT the dot product is taken between the sampled input: x = [x1,…,xN] and each of the basis vectors s_k = [a1,….,aN].
So DFT[k] = x1*a1 + ….+ xN*aN.
From this we can derive the magnitude (scale) and phase (shift) coefficients associated with different basis sinusoid frequencies. We just focused on magnitude in the lecture, but you can get the phase out of the result of the dot product too because the actual DFT dot product involves complex sinusoids (in the sense of complex numbers, a+jb with j=sqrt(-1)) not just real valued sine waves. There’s more detail on this Module 3 lab notebooks (more in the extension notebooks), but the general idea is that the DFT is actually taking the dot product between the (real valued) [x1,…,xN] and a complex sinusoid which we can in turn think of in terms of separate cosine and sine waves of a specific frequency. The following git shows the complex sinusuoid (cycles of the circle top left), and the relation to sine (top right) and cosine functions (bottom left).
[to be continued!…]
Hi Muminah,
Yes, there will be solutions/commentary for the phon and signals labs. I’ll try to post the phon ones next week and the signal ones soon after.
For the TTS and ASR parts of the course (week 5 onwards) you will be working on the course assignments though so there won’t be solutions posted, but you will get feedback on your submissions through the marking.
cheers,
CatherineHi Nickon,
You should watch the videos on speech.zone (i.e., the ones in the “videos” tab for the module) before the lecture.
The lectures will be live, so you should come in-person, but if you want to review it later you can watch the lecture recording via Learn.
cheers,
CatherineYou need to expand the sed command to match the entire line, eg.
^$USER .*$($here means the end of the line,^mean the beginning of the line). But there’s also a tricky thing with sed and newlines, so since you want to delete the whole line, you can use thedflag, i.e. delete:sed -i '/^$USER .*$/d' info.txt
This assumes that it’s just spaces separating the columns.
There are some more examples and explanation of the flags (probably too much info) here:
https://www.gnu.org/software/sed/manual/sed.htmlcheers,
Catherine -
AuthorPosts
 This is the new version. Still under construction.