Forum Replies Created
-
AuthorPosts
-
You’re getting an error for every command you run in Festival, because you’re not using valid Scheme syntax. The commands should be wrapped in parentheses, just like in the instructions or the mentioned post.
This error is simply because you’re using the wrong version of Festival.
Post the exact command you are using to edit
.bashrc.Post the exact commands and error messages (preferably cut-and-paste text, rather than use screenshot) for us to diagnose this. Try these commands and see if your output is similar. Post your output here.
$ cd
$ pwd
/home/atlab
$ ls -l .bashrc
-rw-r--r-- 1 atlab atlab 311 Oct 18 19:22 .bashrc
$ cd Documents/sp/assignment1/
$ ls -l config.scm
-rw-rw-r-- 1 atlab atlab 1257 Oct  9 18:04 config.scm
(assuming you placed your
config.scmin that directory)The vowel and consonant charts on Wikipedia have audio, which you can download and inspect in Praat, where you can of course inspect the waveform, spectrum and spectrogram.
Try Seeing Speech too.
If sounds works in the VM (e.g., you can play a video from speech.zone), then try this to solve an audio issue affecting Festival on some computers.
Yes, harmonics originate in the physical behaviour of the vocal folds. They are real, not just a concept. Of course, they are much, much easier to see and understand in the frequency domain than in the time domain.
You are trying to find the origin of harmonics in the time-domain, which is a good idea, but is never going to be simple. I think the place to start is to convince yourself that any periodic signal that is not a pure tone must have harmonics. This tool is my favourite.
A guitar string, the Millennium Bridge, or (even more spectacularly) the Tacoma Narrows Bridge, all exhibit resonance. In other words, they are filters that selectively amplify some of the input signal (which can be called the source, or the excitation) and produce a very large output signal at certain frequencies.
What is the source in each of these cases?
1. a guitar string making a musical note
2. a piano string making a musical note
3. the Millennium Bridge swaying
4. the Tacoma Narrows Bridge oscillating with a twisting motionYou have two separate problems there.
The first is probably just the keyboard mapping for the VM. Try typing @ on your keyboard and you will probably get ” (for me this is shift plus the 2 key).
The other sounds like a common audio problem and the solution is here.
You are right: most research papers have rather vacuous introductions such as “The popularity of speech synthesis has been rising in recent years.” or other waffle. Do not do that in coursework – there are no marks for this!
So, how to do better? Don’t simply omit the Introduction. Use it to say something meaningful about what is coming up in your report. Have you got a particular approach to the assignment? Did you find an original angle? What are your concrete goals (and don’t just restate the instructions, but give your interpretation). Are there questions you want answers to?
Use an introduction to set up some expectations in the mind of the reader, then make absolutely sure to deliver them later in the paper. Pose questions in the Introduction but don’t give answers. Motivate the reader to want to read on, to find out the answer. Use the Conclusion to remind the reader what was promised and how you have delivered it, leaving them feeling satisfied.
See also this post.
Getting closer… some more clues:
The lowest value of
k(apart from 0), is 1. That’s the lowest frequency DFT “bin” and corresponds to the lowest frequency basis function.The lowest frequency basis function makes just one cycle within the analysis frame. So its frequency in Hertz must be 1 / “duration of the analysis frame in seconds”
We can calculate the duration of the analysis window in seconds if we know how many samples are in the frame and what the sampling frequency is: there is a simple relationship between these three values.
Now we know the frequency of the first bin
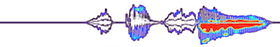
k=1we can work out the frequency of the bink=2and so on all the way up toK.In the magnitude spectrum (i.e., the frequency domain), we see the frequencies present in whatever signal we are analysing: the analysis frame. In the video and that time point, the analysis frame is the visible portion of waveform on the left, which has a duration of 30 ms and contains multiple pitch periods.
You can use the DFT to analyse any amount of waveform (= the analysis frame) that you wish. If you analyse only one pitch period, you will not see any evidence of periodicity. If you analyse a waveform that contains multiple pitch periods (like in the video at the time point) then you will see evidence of periodicity in the magnitude spectrum: harmonics.
You have two separate problems. The solution to the choppy sound issue is probably this.
The “Feature Word not defined” error means that either
a) you are not using the correct voice (which is loaded by
config.scm)or
b) you omitted a step in the pipeline
Don’t change the PATH back to what it was before – this will pick up the old version of Festival, which will not work for the assignment.
Try also looking in the VMware settings for this virtual machine – there are some options to fit the VM to the window and so on – experiment with those.
The other possibility is that your host computer has a very high resolution screen – see if you can adjust its settings to something lower resolution, although that will affect the host operating system too. This does the trick for me on my Mac.
Yes, nearly. In TD-PSOLA, our representation of the filter is the impulse response. This is a single pitch period. A diphone is a sequence of pitch periods.
Why can’t we store a single pitch period to represent the filter for a complete diphone?
total_entropy = ( sum(left_counts)*entropy(left_counts) + sum(right_counts)*entropy(right_counts) ) / (sum(left_counts) + sum(right_counts))
-
AuthorPosts
 This is the new version. Still under construction.