› Forums › Foundations of speech › Signal processing › Explaining DFT Formula
- This topic has 5 replies, 2 voices, and was last updated 4 years, 7 months ago by
Simon.
-
AuthorPosts
-
-
October 8, 2020 at 13:35 #12289
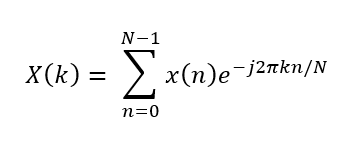
Could you please unpack the terms in the DFT equation for me please and explain how they interact with one-another (perhaps via. the sine wave or unit circle as analogies)
i struggled to conceptualise what
kwas, and why the exponential term is as it is and what that means -
October 9, 2020 at 09:42 #12297
I’ll start you off with this and you try to complete it – I’m going to use square brackets to index everything to emphasise that we are dealing with discrete (= digital) signals only, and to match the notation in the
sp-m1-4-discrete-fourier-transformnotebook.x[n] is the waveform. n is indexing time. To plot x[n], we place n on the horizontal axis and label it “time (samples)” then plot the value of x[n] at each value of n. We have drawn the waveform.
X[k] is the Discrete Fourier Transform of x[n]. k is indexing BLANK. To plot X[k], we place BLANK on the horizontal axis and label it “BLANK” then plot the value of X[k] at each value of k. We have drawn the BLANK.
Can you fill in some of the BLANKs?
-
October 12, 2020 at 19:35 #12358
I believe that:
kis indexing the component frequencies we are running DFT on to get their coefficients of correlation with the complex waveform we are trying to deconstruct. We iterate fromktoKwhereKis the nyquist frequency.To plot
X[k]we place frequencies from k to K on the horizontal axis and label it frequencies, and then we plot the magnitude of that frequency given X[k] on the vertical axis, and we have drawn our frequency spectrum…..I hope i have got it?
-
-
October 13, 2020 at 10:14 #12413
Yes, you’ve got it. k is indexing frequency – sometimes we say it is the DFT “bin”.
When plotting X[k] the axis will run from 0 to K (not from k to K). We could label that axis with the integers 0 to K (some of the notebooks do that), or we could convert k to Hz and label the axis with frequency.
How do we convert the integer k into a frequency in Hz ?
-
October 23, 2020 at 14:31 #12672
is
kthe number of cycles of the circle we do in a second, and so hertz would just bek…? sorry i’m finding it quite confusing -
October 23, 2020 at 15:16 #12674
Getting closer… some more clues:
The lowest value of
k(apart from 0), is 1. That’s the lowest frequency DFT “bin” and corresponds to the lowest frequency basis function.The lowest frequency basis function makes just one cycle within the analysis frame. So its frequency in Hertz must be 1 / “duration of the analysis frame in seconds”
We can calculate the duration of the analysis window in seconds if we know how many samples are in the frame and what the sampling frequency is: there is a simple relationship between these three values.
Now we know the frequency of the first bin
k=1we can work out the frequency of the bink=2and so on all the way up toK.
-
-
AuthorPosts
- You must be logged in to reply to this topic.

 This is the new version. Still under construction.