Forum Replies Created
-
AuthorPosts
-
The signal you describe is quite extreme. Those other harmonics exist but have zero amplitude. Even the fundamental (we could call this the first harmonic) has zero amplitude.
A more reasonable example would be a square wave, in which only the odd harmonics have energy and all the even ones (2nd, 4th, 6th, …) have zero amplitude.
I’ll bring a tuning fork to main lecture 2, and we’ll find out…
We’ll look at this in main lecture 2.
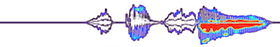
The spectrum and spectrogram are showing us exactly the same information. The spectrum is for a single frame of speech, and the spectrogram is for a sequence of frames (so will reveal changes in the spectrum over time).
We’ll go over this in main lecture 2.
I think you’re referring to the way Praat defaults to plotting spectrograms with a frequency axis from 0 to 5000Hz, regardless of the sampling rate. In other words, Praat often does not show the full frequency range of the signal.
Why do you think Praat limits the frequency range when plotting spectrograms?
In Wavesurfer, the spectrogram is always plotted from 0 to the Nyquist frequency (half the sampling rate).
It’s always good to know several tools.
I find Wavesurfer faster and easier to use, and it’s widely used in speech technology for tasks such as labelling speech. Praat is the more common tool in the field of phonetics, and is more powerful. Personally, I don’t like the way Praat labels the axes (it doesn’t provide tick marks).
Use whichever you prefer.
For this course, the older edition will be OK, at least for the first 6 chapters.
Good question! Think about the relative width and length of of the vocal tract, and what resonant frequencies each would give rise to.
We’ll answer this question properly in main lecture 2.
September 27, 2016 at 20:59 in reply to: Differentiate between synthesised speech and natural ones #4992Yes, we can almost always tell. Look at some of the synthetic speech provided here
and see what you can discover for yourself. We can revisit this question after one or two lectures on speech synthesis – so ask it again then.
Sampling happens when we convert from analogue to digital, so we need to worry about the Nyquist frequency then: when we record the raw data.
Our soundcard takes care of this for us. It includes a low-pass filter to remove all frequencies above the Nyquist frequency. This is done in the analogue domain, before going digital.
We also need to take care to do the equivalent thing when digitally downsampling any previously-recorded signal: our downsampling program must include a low-pass filter before the down-sampling step.
Well-spotted! You are correct that signals close to the Nyquist frequency will not be very well represented. We’ll look at this in foundation lecture 2.
Can you give some examples of objects that you have in mind?
The Bernoulli effect:
+ more on this in the lecture, probably.
That symbol means “is equal by definition“. We use it when we want to make it clear that the right-hand side of the equation means the same thing as the left-hand side. In other words, no derivation or manipulation or intermediate steps are needed to derive the right-hand side from the left-hand side.
It would be fine to use the normal equals sign (=) in this situation too, but the “equal by definition” is meant to be more helpful to the reader.
This is the error
2016-07-25 19:10:11,858 CRITICALListDataProvider: the number of frames in label and acoustic features are different: 378 vs 0
Having 0 frames is obviously a silly bug somewhere – inspect your files carefully. Reduce the validation set to a single sentence, reproduce the error, then inspect all the relevant files for that sentence.
-
AuthorPosts
 This is the new version. Still under construction.