Remember to watch the module videos before the Thursday Lecture!
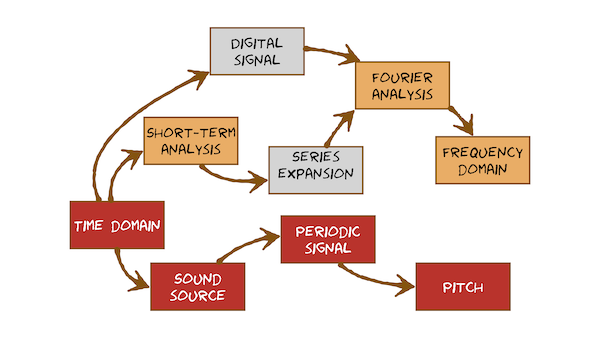
In this module we will look at how the speech produced by a physical system is captured as a digital signal, i.e., how it goes from a pressure wave to a sequence of 0s and 1s on your computer. We will see how engineering decisions affects what we can capture and what sort of analysis we can do. The most important constraint we will come up against is sampling rate. Given a digitized waveform, we then introduce the Discrete Fourier Transform (DFT) as a method of mapping from the time domain to the frequency domain. The DFT is what allows us to create spectrograms. We’ll see that the frequency domain is a much more more convenient place to do speech processing than the time domain. But, again, the fact that we’re working with digital signals determines what we actually get out of a spectrogram.
The Discrete Fourier Transform (and signal processing in general) uses sine and cosine functions a lot. If you haven’t thought about sines and cosines for a while (SOH CAH TOA ring any bells?), you might also want to brush up on some trigonometry and vectors:
- a great intro to vectors/linear algebra
- a quick trig refresher
- a nice video on radians
- A great primer on sine waves, trigonometry and sampling and other concepts relating to Digital Signal Processing which this Module will touch on.
We won’t ask you to derive the DFT equation etc, but knowing a bit more maths will help develop your intuitive understanding of what’s going on here.
Here’s what you are going to learn in this module’s videos:
Lecture Slides
Lecture 3 slides (google slides) [updated 1/10/2024 ]
